Sea Levels Analysis
Analyzing different terrains to collect data on effect of rising sea levels
November 2023
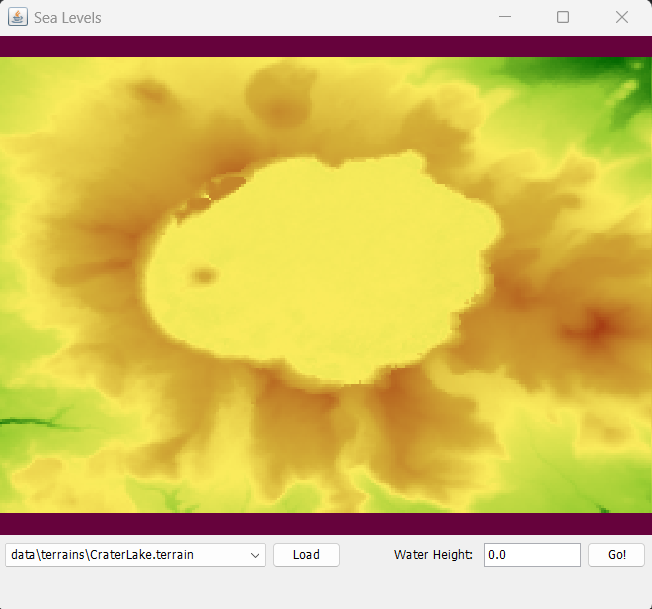
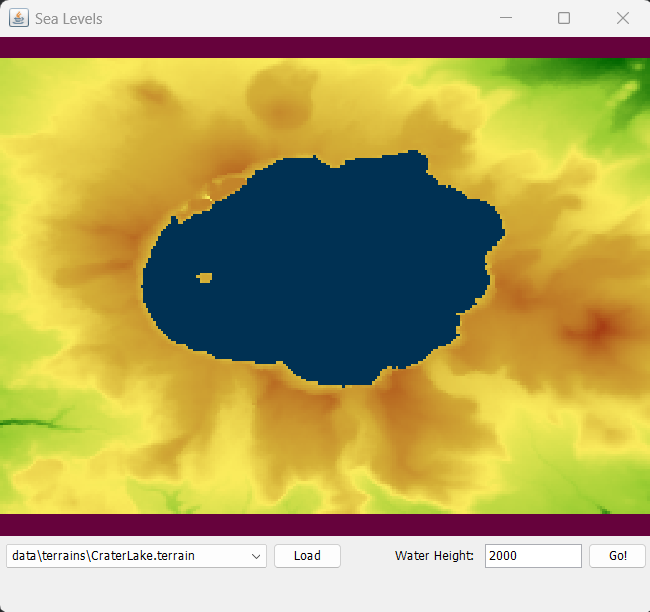
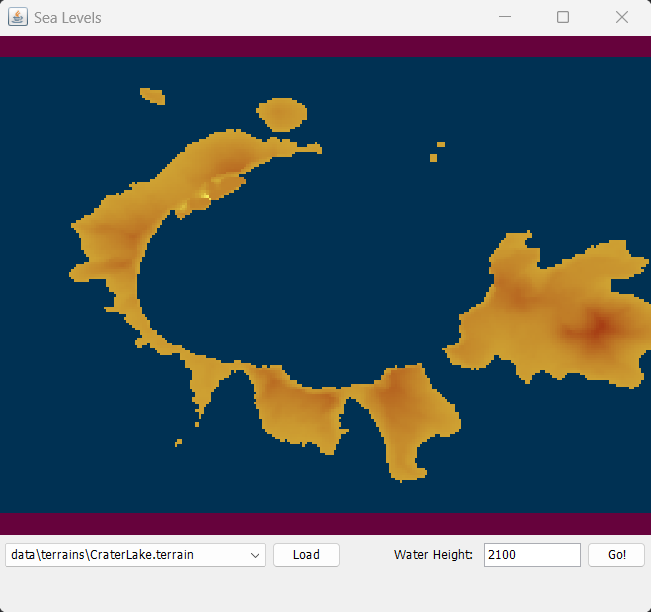
The Sea Levels Analysis Application is a powerful tool for environmental analytics, providing insight into the potential impact of rising sea levels on our terrain. Its core functionality involves identifying coordinates of a landscape that would be submerged under a specified sea level increase. This application offers a comprehensive view of the areas most vulnerable to sea level changes.
Technical Insights
The application implements graph theory to model the intricate relationships between sea level heights and corresponding terrain coordinates. I employed graph vertices to represent individual coordinates, with edges connecting neighboring coordinates. The sea level heights were seamlessly integrated into this graph structure, forming a comprehensive framework to analyze the potential submersion of different terrain elements.
The key technical innovation was the utilization of Breadth-First Search (BFS) algorithms to efficiently traverse the graph and identify all coordinates below the specified sea level. This approach ensured accuracy and speed in pinpointing the impacted areas.
Application
The Sea Levels Analysis Application seamlessly combines theoretical concepts with practical application, offering a user-friendly interface for analysts to explore the complex relationship between sea level changes and our environment. By providing a visual representation of submerged coordinates, this tool provides functionality to users in making informed decisions surrounding climate change and its environmental ramifications.
Please note the graphical user interface was created by UBC’s CPEN 221 teaching team.


